
A complete walkthrough of the ClimRR Local Projections Tool, from selecting a location to downloading your report.
The Local Projections page lets you explore future projections for any point, county, state, or custom area in the United States. View projections on a map, in an interactive chart, a statistics table, or a downloadable PDF report.
Use your mouse scroll wheel or the zoom in / zoom out buttons on the map to navigate to your area of interest.
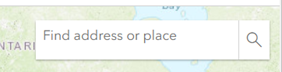
Type an address, city, or other location name into the search bar to automatically pan and zoom the map.
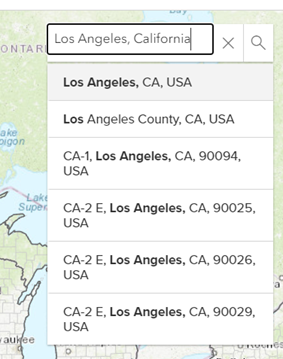
As you type, autocomplete suggestions appear below the search bar. Click a suggestion to navigate directly to that location.
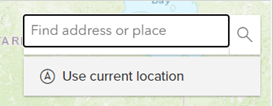
If your browser permissions allow location access, a Use current location option will appear when you click into the search bar.
To drop a pin, click once anywhere on the map. A marker will appear at the selected location, and the sidebar will populate with future conditions statistics for that point.
Tip: zoom in before clicking to place your pin more precisely.
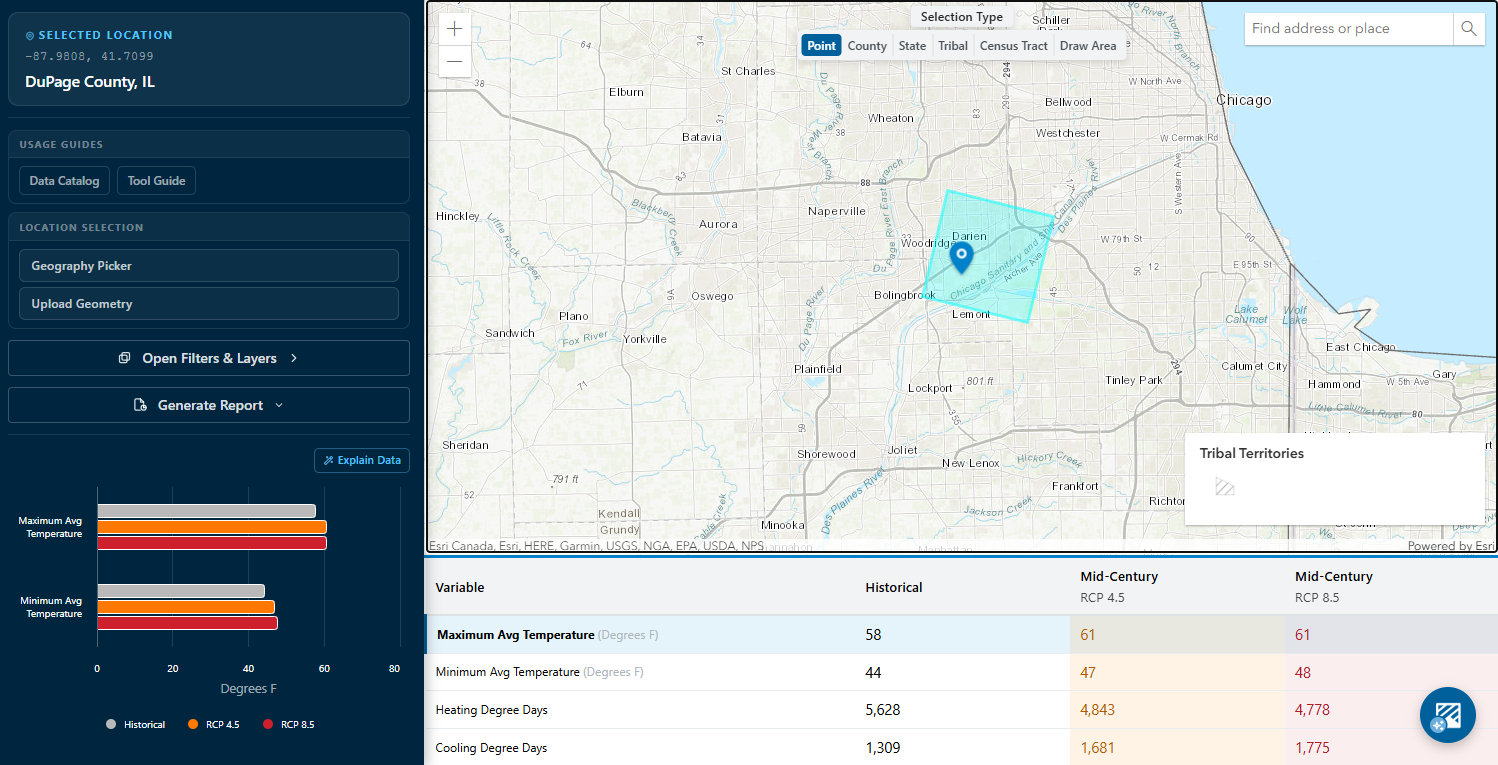
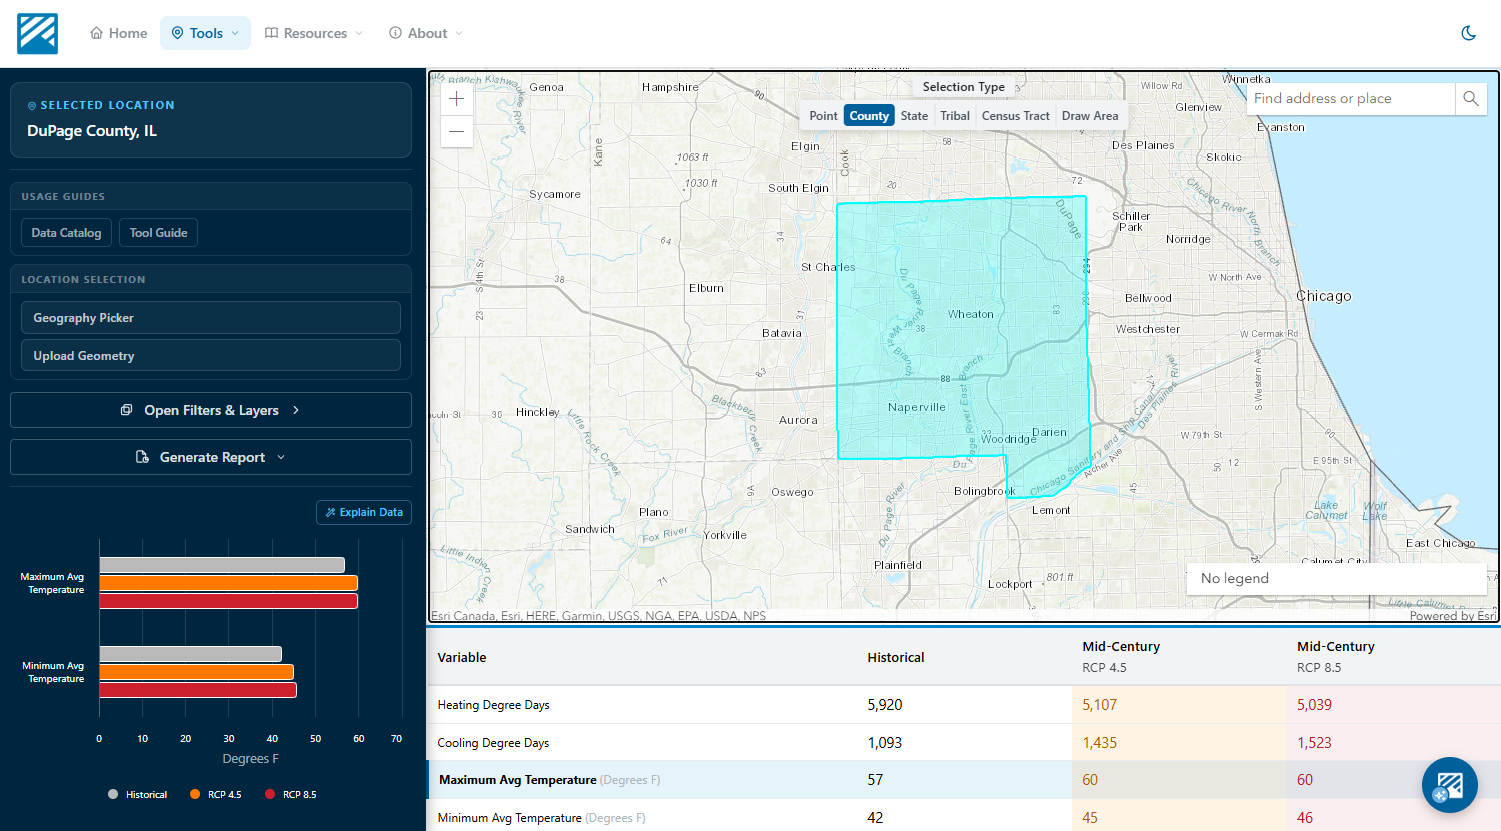
Click County in the Selection Mode menu at the top of the map. The county option highlights a county when you hover over it. Click to lock the selection, and the table and charts update with aggregated statistics for that county.
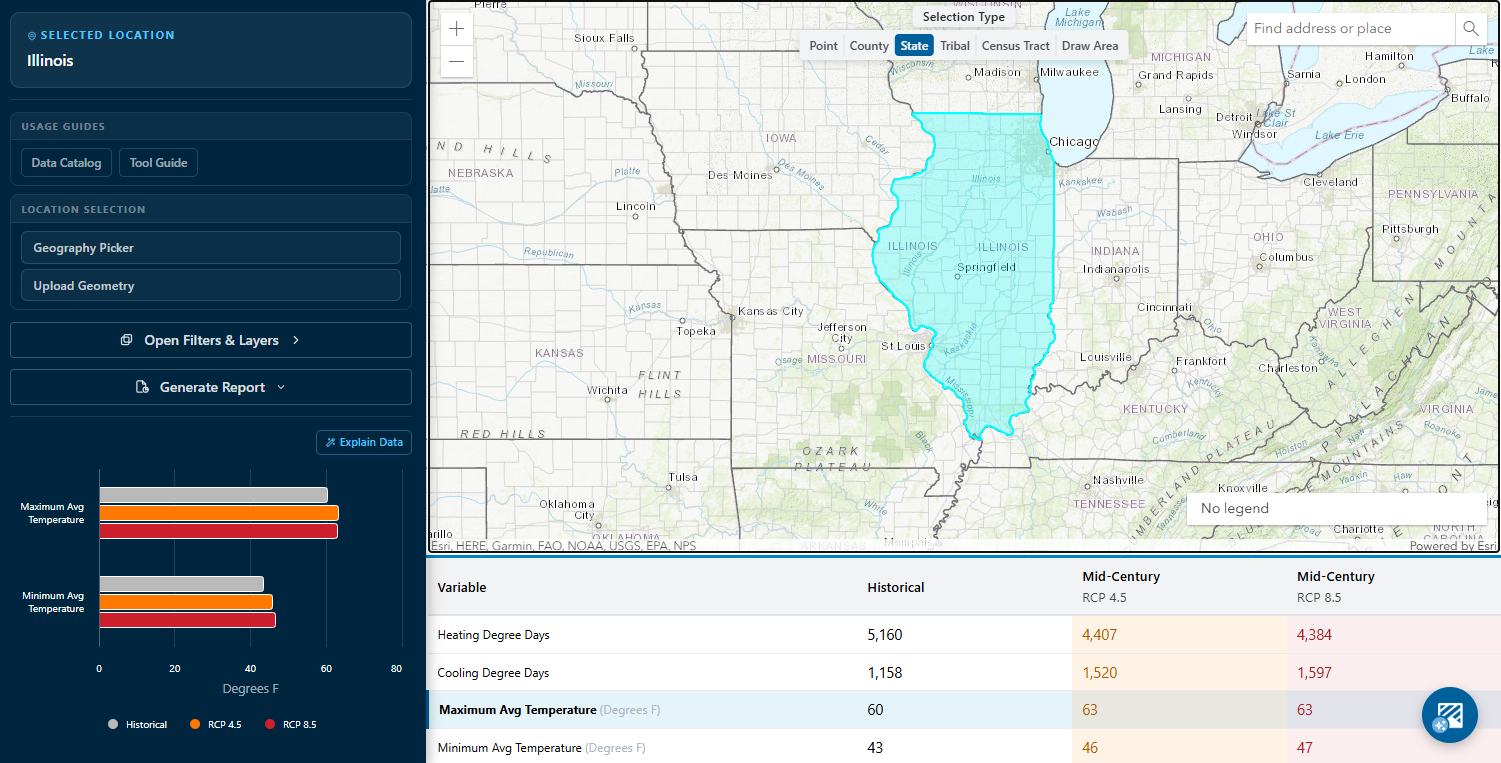
The State selection mode works identically. Hover to highlight, click to select, and the statistics panel updates with state-level aggregated data.
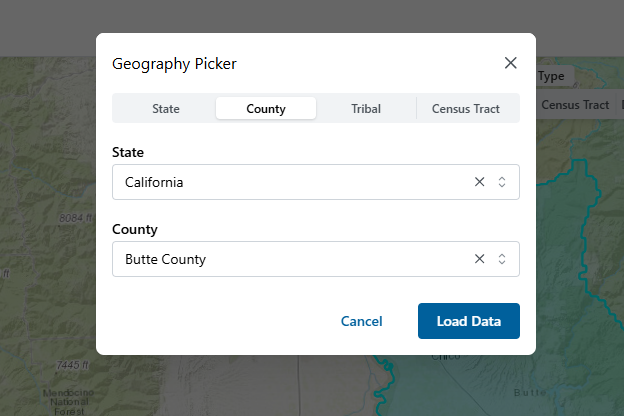
The Geography Picker button in the left-hand panel opens a dialog that lets you select a state or county via dropdown menus. This is useful when you already know the area you want without having to find it on the map.
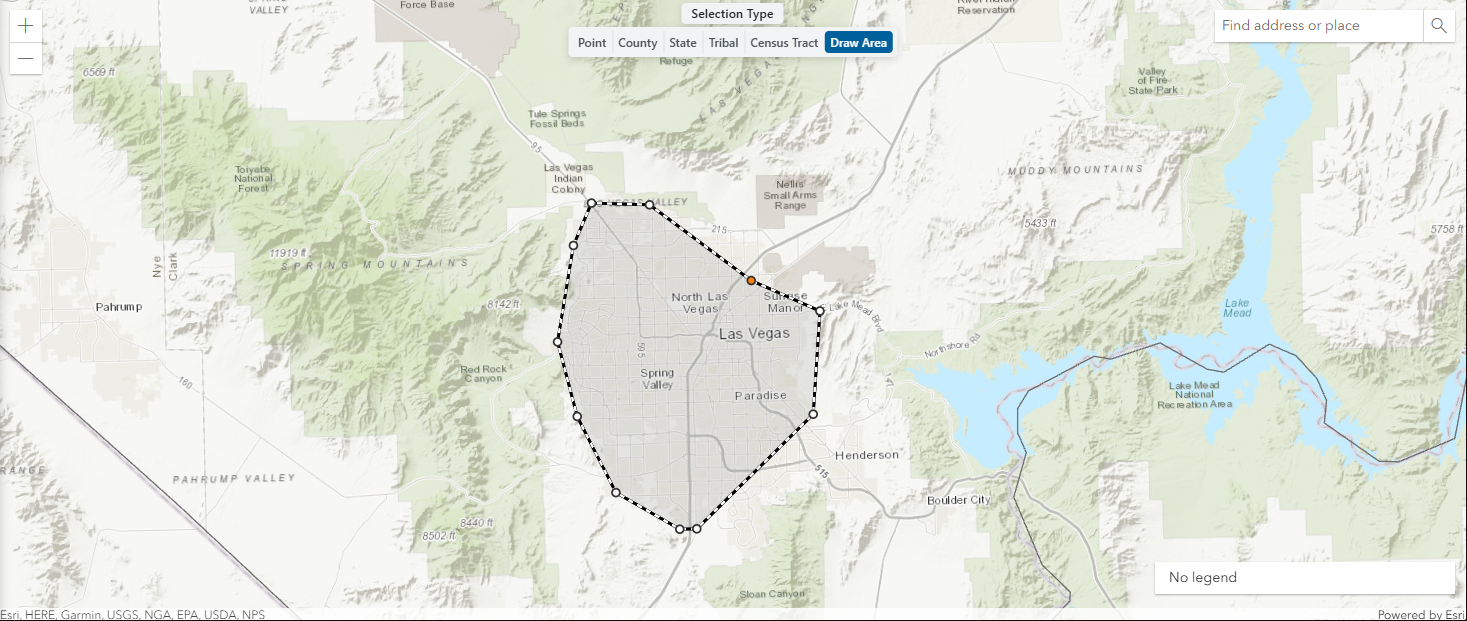
Select Draw Area in the Selection Mode menu to activate the polygon-drawing tool. Click the map to add points incrementally, then double-click to close the polygon. The map zooms to your shape and loads aggregated statistics for the drawn area. Use the Reset button to clear your drawing and start over.
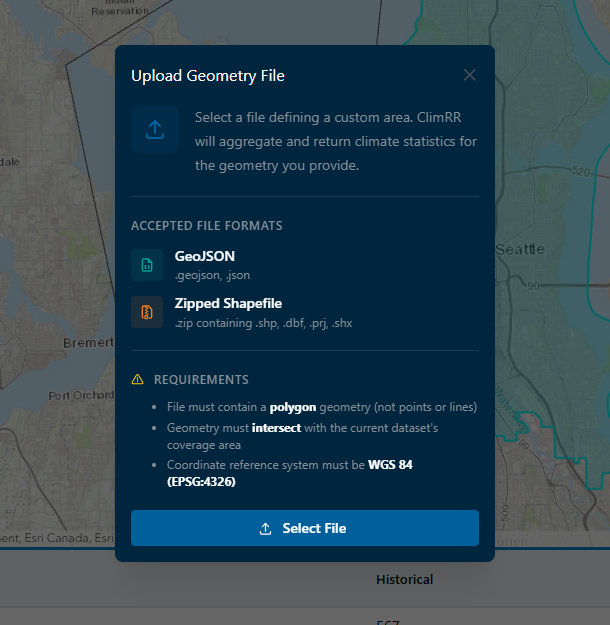
Click Upload Geometry in the left-hand panel to open the upload dialog. Upload a file in GeoJSON or zipped Shapefile format. Once processed, the geometry appears on the map and aggregated statistics load automatically.
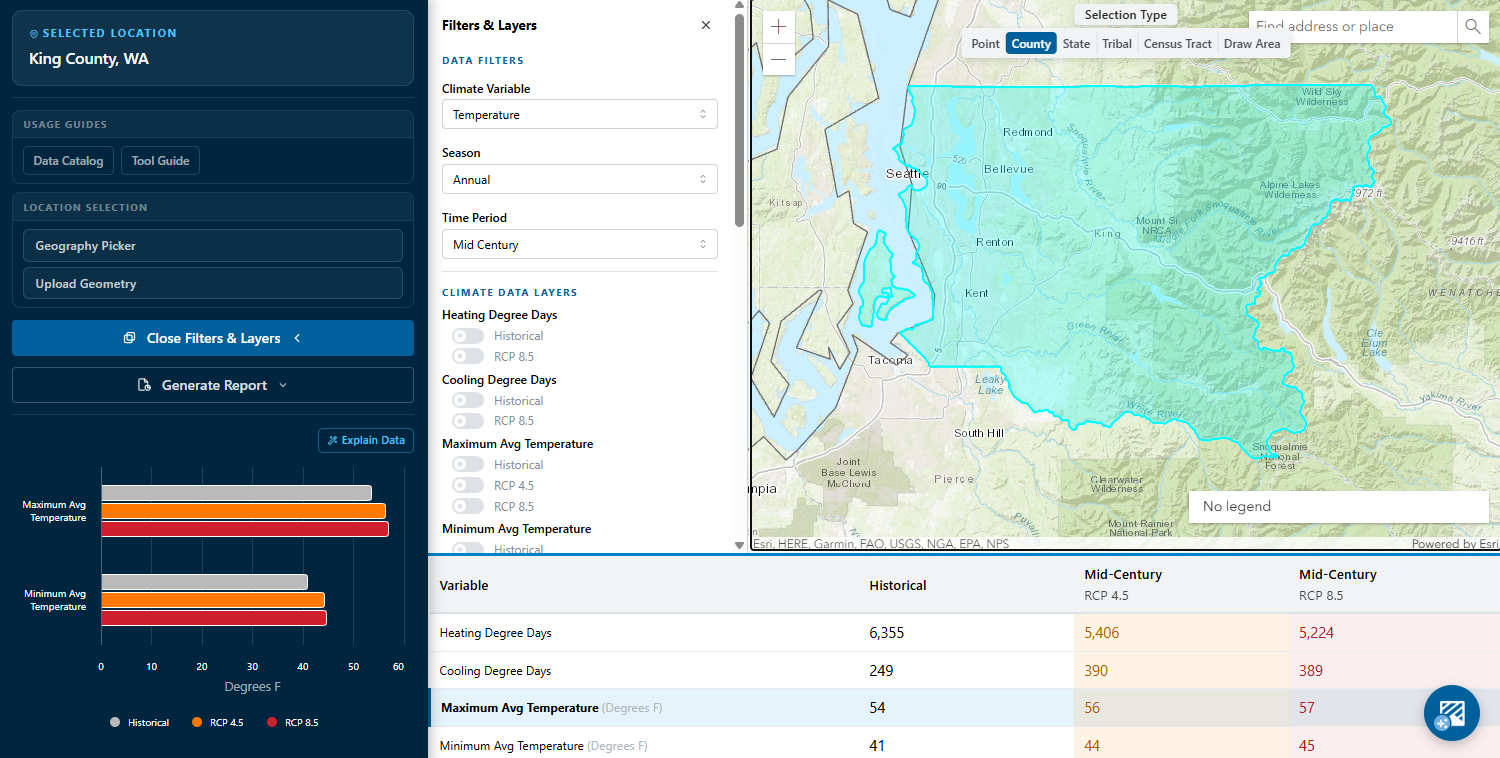
Click Open Filters & Layers in the sidebar to access data filter controls. These control which statistics are displayed when a location is selected:
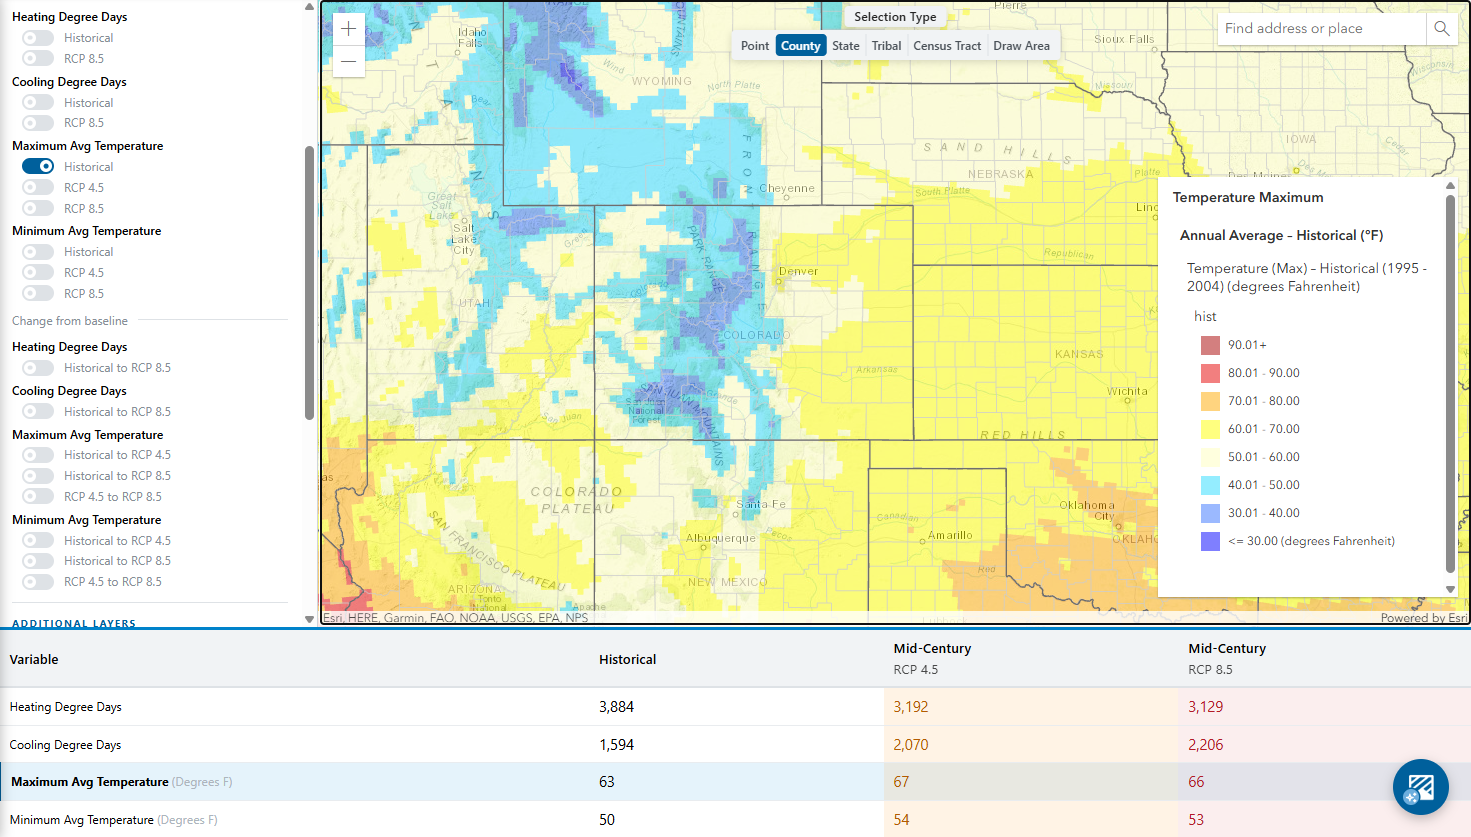
Map Layers matching the active filters can be toggled on and off to visualize data geographically:
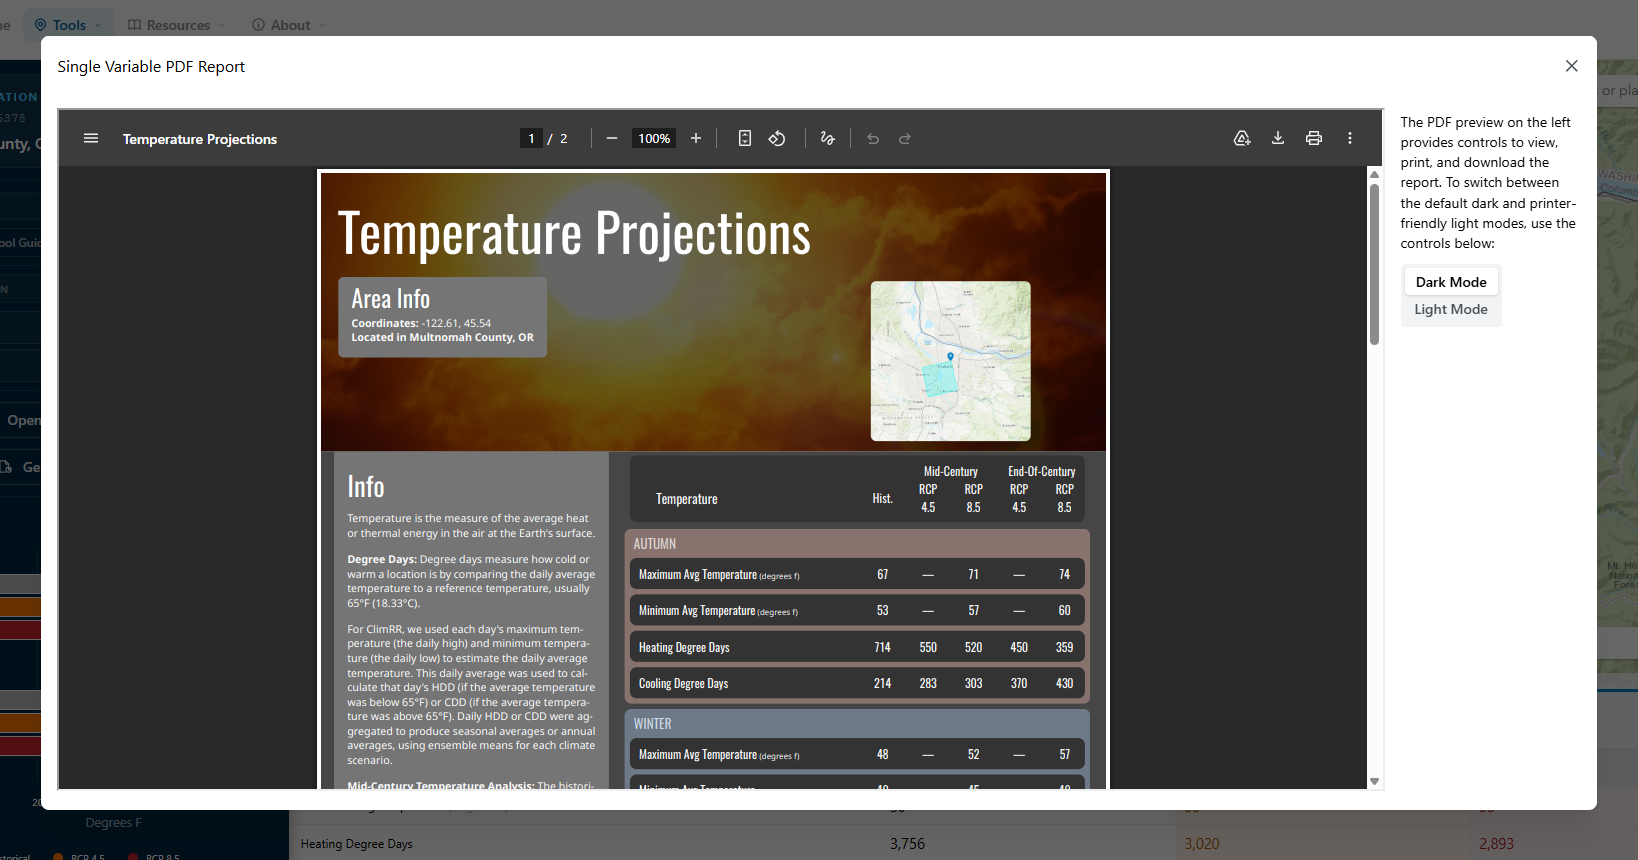
With a location selected, click the Generate Report button to see available report formats. Choose a PDF (single variable or all variables) or a CSV download.
When a PDF option is selected, a viewer opens in the page. Reports are available in dark mode and light (printer-friendly) mode. Toggle between modes using the controls at the top of the viewer, then use the built-in toolbar to download or print.
There is a lot to discover on ClimRR. Download data, explore all future projection layers in detail using our Local Projections Tool, or learn more about future projections, the science behind them, and how this information can inform planning and decision-making.
